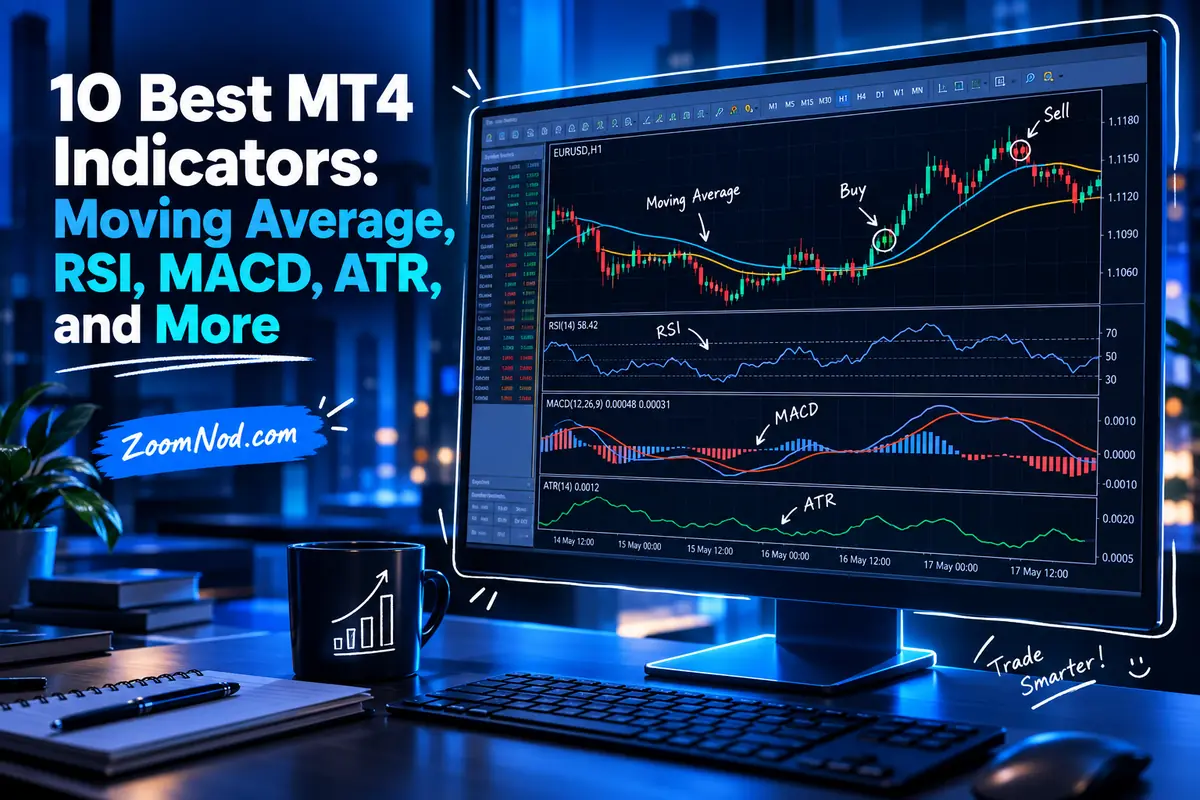
10 Best MT4 Indicators in 2026: Moving Average, RSI, MACD, ATR, and More
MetaTrader 4 includes a large library of built-in technical indicators that can help traders measure trend, momentum, volatility, and market conditions. The challenge is not finding indicators—it is choosing a small set that answers different questions without duplicating the same information.
The most useful built-in MT4 indicators to learn in 2026 include Moving Average, RSI, MACD, Bollinger Bands, Average True Range, Stochastic Oscillator, ADX, Parabolic SAR, Ichimoku Kinko Hyo, and Momentum. None of them guarantees profitable trading. Their value comes from helping traders define repeatable rules, measure conditions, and manage risk.
MetaTrader 4 remains actively maintained in 2026, and its core indicator framework is still widely used across forex and CFD trading. MT4 also supports custom MQL4 indicators, but beginners usually benefit more from mastering the native tools before installing third-party software.
This guide explains ten MT4 indicators, what each measures, where it is most useful, common default settings, practical combinations, and the mistakes that cause traders to overfit charts.
Risk notice: indicators analyze historical and current market data. They do not predict the future with certainty. Leveraged forex and CFD trading can result in rapid losses.
TL;DR: Best MT4 Indicators in 2026
| Indicator | Category | Best For | Primary Question |
|---|---|---|---|
| Moving Average | Trend | Trend direction and smoothing | What direction is price generally moving? |
| RSI | Momentum oscillator | Momentum and divergence | Is momentum stretched or weakening? |
| MACD | Trend/momentum | Momentum shifts and crossovers | Is trend momentum strengthening or changing? |
| Bollinger Bands | Volatility | Volatility expansion and contraction | Is volatility compressed or expanded? |
| ATR | Volatility | Stop distance and volatility measurement | How much is the market moving? |
| Stochastic Oscillator | Momentum oscillator | Range trading and momentum turns | Where did price close relative to its recent range? |
| ADX | Trend strength | Trend vs range filtering | Is a meaningful trend present? |
| Parabolic SAR | Trend/exits | Trailing stop concepts | Where might trend-following exits move? |
| Ichimoku | Trend/support/resistance | Multi-factor trend structure | What is the broader trend and support/resistance picture? |
| Momentum | Momentum | Rate-of-change style confirmation | Is price movement accelerating or weakening? |
What Are MT4 Indicators?
Technical indicators are mathematical calculations based on market data such as price and volume.
MetaTrader 4 groups indicators into categories such as:
- Trend indicators
- Oscillators
- Volume indicators
- Bill Williams indicators
Some indicators are overlaid directly on the price chart, while others appear in a separate sub-window.
MetaTrader’s own documentation notes that trend indicators generally help identify direction, while oscillators help identify turning conditions or momentum changes.
1. Moving Average — Best MT4 Indicator for Basic Trend Direction
Best for: identifying general trend direction, smoothing price noise, and creating systematic crossover rules.
A Moving Average calculates an average price over a selected number of periods.
MT4 includes several moving-average methods:
- Simple Moving Average (SMA)
- Exponential Moving Average (EMA)
- Smoothed Moving Average (SMMA)
- Linear Weighted Moving Average (LWMA)
How Traders Use It
- Price above MA = bullish trend filter
- Price below MA = bearish trend filter
- Fast MA crossing slow MA
- MA used as dynamic support/resistance reference
Common Settings
Popular periods include 20, 50, 100, and 200, but no period is universally best.
A shorter average reacts faster and generates more signals. A longer average is smoother but slower.
Main Weakness
Moving averages lag price. In sideways markets, repeated crossovers can create false signals.
2. Relative Strength Index — Best for Momentum and Divergence
Best for: measuring momentum, identifying stretched conditions, and finding divergences.
RSI is an oscillator ranging from 0 to 100.
MetaTrader’s official documentation notes that a 14-period setting is commonly associated with the indicator’s original formulation, although other periods are also used.
Common Interpretation
- Above 70: commonly treated as overbought
- Below 30: commonly treated as oversold
- Divergence: price and RSI move differently
- Failure swings: momentum structure changes
Important Warning
Overbought does not automatically mean “sell.”
In a strong uptrend, RSI can remain elevated for an extended period. Similarly, oversold readings can persist during a strong downtrend.
Use RSI with trend context.
3. MACD — Best for Trend and Momentum Crossovers
Best for: identifying changes in trend momentum and comparing shorter and longer exponential moving averages.
MT4’s MACD implementation is based on the relationship between a 12-period EMA and 26-period EMA, with a 9-period signal line in the standard configuration.
Common Signals
- MACD crossing above signal line
- MACD crossing below signal line
- Crossing the zero line
- Bullish divergence
- Bearish divergence
Best Market Type
MACD is generally more useful in markets with sustained movement than in extremely flat price action.
Main Weakness
It can react after a large portion of the move has already happened.
4. Bollinger Bands — Best for Volatility Compression and Expansion
Best for: measuring volatility, spotting tight consolidations, and framing price movement relative to a moving average.
Bollinger Bands typically consist of:
- A middle moving average
- An upper band
- A lower band
The outer bands are based on standard deviation, so they widen as volatility rises and contract as volatility falls.
Common Default
A widely used configuration is a 20-period Simple Moving Average with bands two standard deviations away from the middle line.
Useful Concepts
- Band squeeze
- Volatility expansion
- Mean-reversion context
- Trend continuation outside bands
Main Weakness
Touching the upper band is not automatically a sell signal, and touching the lower band is not automatically a buy signal.
Strong trends can “walk” along a band for many candles.
5. Average True Range — Best MT4 Indicator for Volatility and Stops
Best for: measuring market volatility and setting stop distances that adapt to current price movement.
Average True Range does not tell you whether price should go up or down.
It measures how much the market has been moving.
True Range considers:
- Current high minus current low
- Distance from previous close to current high
- Distance from previous close to current low
Practical Uses
- Volatility-adjusted stop loss
- Position sizing
- Identifying quiet consolidation
- Avoiding fixed-pip stops across very different pairs
Example
If EUR/USD has a much lower ATR than GBP/JPY, using the same 20-pip stop on both markets may create completely different risk behavior.
Why ATR Is Important
ATR can connect chart analysis to risk management rather than acting only as an entry signal.
6. Stochastic Oscillator — Best for Range Trading and Momentum Turns
Best for: range conditions, short-term momentum shifts, and identifying where price closed relative to its recent range.
The Stochastic Oscillator contains two lines, commonly called %K and %D.
MetaTrader documentation describes several common interpretations:
- Moves above and below overbought/oversold zones
- %K/%D crossovers
- Divergence between price and oscillator
Best Market Type
Stochastic can be useful in a well-defined range.
Main Weakness
Like RSI, it can stay overbought or oversold during strong trends. Using it without trend context can cause repeated countertrend trades.
7. ADX — Best for Measuring Trend Strength
Best for: deciding whether a market is trending strongly enough for a trend-following strategy.
ADX stands for Average Directional Movement Index.
The full system also uses:
- +DI
- -DI
- ADX
The directional indicators help describe bullish versus bearish pressure, while ADX helps describe trend strength.
Why ADX Is Useful
Many strategies fail because they are applied in the wrong regime.
For example:
- Moving-average crossover may perform poorly in a flat range.
- Mean-reversion strategies may perform poorly during strong trends.
ADX can act as a regime filter.
Main Weakness
ADX does not by itself tell you whether the trend is up or down. Combine it with price structure or +DI/-DI.
8. Parabolic SAR — Best for Trend-Following Exit Logic
Best for: trailing-stop concepts and visually tracking trend direction.
Parabolic SAR plots dots above or below price.
In an uptrend, dots generally appear below price. In a downtrend, they generally appear above.
Practical Use
Traders may use the indicator as a trailing exit reference.
MetaTrader’s official documentation specifically describes Parabolic SAR as useful for exit points in trending markets.
Main Weakness
In sideways markets, SAR can flip repeatedly and create many false reversals.
It works better when another tool first confirms that the market is trending.
9. Ichimoku Kinko Hyo — Best All-in-One Trend Structure Indicator
Best for: traders who want one indicator combining trend, support/resistance, momentum context, and future cloud structure.
Ichimoku includes several components:
- Tenkan-sen
- Kijun-sen
- Senkou Span A
- Senkou Span B
- Chikou Span
The cloud, or Kumo, helps visualize trend structure and potential support/resistance areas.
Why Ichimoku Is Powerful
It can answer multiple questions at once:
- Is price above or below the cloud?
- Are the faster and slower lines aligned?
- Is future cloud structure bullish or bearish?
- Where are important equilibrium zones?
Main Weakness
The chart can look complicated to beginners.
Learn each component separately before using multiple Ichimoku conditions as one signal.
10. Momentum — Best Simple Rate-of-Change Confirmation Tool
Best for: evaluating whether price movement is accelerating, decelerating, or diverging from recent history.
The Momentum indicator compares the current price with the price from a previous period.
It can be used as:
- A trend-following oscillator
- A divergence tool
- A confirmation filter
Why It Is Useful
Momentum is simpler than MACD and can help traders see when price continues in one direction but the rate of movement starts weakening.
Main Weakness
Momentum is not a complete entry system. It needs context from trend, structure, volatility, or support/resistance.
Best MT4 Indicators by Trading Style
| Trading Style | Indicators to Research |
|---|---|
| Trend following | Moving Average, ADX, MACD, Ichimoku |
| Range trading | RSI, Stochastic, Bollinger Bands |
| Volatility trading | ATR, Bollinger Bands |
| Trailing exits | Parabolic SAR, ATR |
| Momentum confirmation | RSI, MACD, Momentum |
| Multi-factor trend analysis | Ichimoku, ADX |
Best MT4 Indicator Combinations
Moving Average + RSI + ATR
This combination gives three different types of information:
- Moving Average: trend direction
- RSI: momentum
- ATR: volatility
That is better than stacking three momentum oscillators that all say nearly the same thing.
ADX + Moving Average
Use ADX to ask whether a trend is strong enough, then a moving average to define direction.
Bollinger Bands + RSI
Useful for range conditions when price stretches toward an outer band while momentum reaches an extreme.
Do not assume this combination works during strong trends.
Ichimoku Alone
Ichimoku is already a multi-component system. Adding many more indicators can make the chart harder to interpret.
How Many MT4 Indicators Should You Use?
More indicators do not automatically create better analysis.
A practical approach is to select one tool from different categories:
- Trend
- Momentum
- Volatility
- Risk/exit
For example:
Trend: 50 EMA
Momentum: RSI
Volatility: ATR
Exit: price structure or ATR-based stop
This provides different information without covering the chart in conflicting signals.
How to Add an Indicator in MT4
Built-in MT4 indicators can be added through the Navigator or the platform’s Insert > Indicators menu.
A simple workflow is:
- Open a chart.
- Choose the desired timeframe.
- Open Navigator or Insert > Indicators.
- Select the indicator.
- Set parameters.
- Choose colors and visualization options.
- Save the chart as a template if desired.
You can also drag many indicators directly onto a chart.
How to Install a Custom MT4 Indicator
MT4 supports custom indicators written in MQL4.
However, custom code introduces risk.
Only install indicators from sources you trust.
Before using a third-party indicator:
- Understand what it calculates.
- Check whether it repaints historical signals.
- Scan downloaded files.
- Test it on demo.
- Do not grant unrelated system access.
Many traders do not need custom indicators at all. The native MT4 library covers most foundational technical-analysis concepts.
Do MT4 Indicators Repaint?
A repainting indicator changes historical signal values after new data arrives.
Some indicators naturally update the current unfinished candle. That is not necessarily malicious repainting.
The real concern is when an indicator changes past completed signals in a way that makes historical performance look unrealistically accurate.
When evaluating a custom indicator:
- Test it live on demo.
- Record screenshots.
- Compare signals after candles close.
- Do not trust a perfect historical chart.
MT4 Indicators vs Expert Advisors
An indicator analyzes and displays information.
An Expert Advisor can contain trading logic and place or manage orders automatically.
An EA may use one or several indicators as inputs.
For example:
If 50 EMA > 200 EMA
AND RSI crosses above 50
AND ATR is above minimum volatility
THEN consider long entry
This turns subjective chart reading into a rule that can be tested.
If you automate indicator logic, Zoomnod’s VPS for MT4 guide explains how to keep the platform online continuously.
Why a Forex VPS Can Matter for Indicator-Based Automation
A manual indicator user does not need a VPS.
A VPS becomes useful when:
- An EA trades 24/5
- Signals must be copied continuously
- Scripts run around the clock
- Your home internet or computer is unreliable
For deployment, Zoomnod’s Forex VPS setup guide covers the practical server workflow.
Which Broker Should You Use for MT4 Indicators?
The indicators themselves are part of MetaTrader, but brokers determine:
- Price feed
- Tradable symbols
- Spreads
- Execution
- Account type
- Server infrastructure
Zoomnod’s best MetaTrader 4 brokers guide compares ten current MT4 providers and their 2026 platform support.
How to Test an MT4 Indicator Strategy
Step 1: Define Exact Rules
“Buy when RSI looks strong” is not testable.
“Buy when RSI closes above 50 while price is above the 200 EMA” is testable.
Step 2: Define the Stop
Do not test entries without defining losses.
Step 3: Include Spread and Commission
A high-frequency strategy can look profitable before costs and fail after costs.
Step 4: Test Different Market Regimes
Include:
- Trends
- Ranges
- High volatility
- Low volatility
Step 5: Forward Test on Demo
Historical testing should be followed by real-time demo observation.
Zoomnod’s forex demo account guide explains how to make demo testing more realistic.
Common MT4 Indicator Mistakes
Using Too Many Indicators
Five tools measuring momentum do not provide five independent confirmations.
Changing Settings After Every Loss
Constant optimization can overfit historical noise.
Ignoring Market Regime
Range indicators can fail during trends, while trend indicators can whipsaw in ranges.
Treating Overbought as Automatic Sell
Momentum extremes can persist.
Ignoring Risk Management
A good signal with oversized risk can still destroy an account.
Buying Unknown “Holy Grail” Indicators
No technical indicator can guarantee future market direction.
MT4 Indicator Selection Checklist
- What does the indicator actually measure?
- Is it trend, momentum, volatility, or volume?
- Does another indicator already provide the same information?
- Does it repaint?
- What market regime is it designed for?
- What is the exit rule?
- What is the stop rule?
- Has the strategy been forward-tested?
Final Verdict: What Are the Best MT4 Indicators in 2026?
Moving Average is the best starting point for trend direction, RSI for momentum, MACD for trend-momentum changes, Bollinger Bands for volatility structure, ATR for risk and stop calibration, Stochastic for range momentum, ADX for trend strength, Parabolic SAR for trailing exits, Ichimoku for multi-factor trend analysis, and Momentum for a simple rate-of-change view.
You do not need all ten on one chart.
A stronger approach is to choose a few indicators that measure different things and then convert them into a written strategy that can be tested.
Indicators are tools for structuring decisions. They are not substitutes for position sizing, broker selection, execution quality, and risk control.
Frequently Asked Questions About MT4 Indicators
What are the best MT4 indicators?
Moving Average, RSI, MACD, Bollinger Bands, ATR, Stochastic, ADX, Parabolic SAR, Ichimoku, and Momentum are among the most useful built-in MT4 indicators to learn.
Which MT4 indicator is best for beginners?
A Moving Average is one of the simplest starting tools because it helps visualize general trend direction without adding much chart complexity.
Which MT4 indicator is best for volatility?
ATR is useful for measuring volatility numerically, while Bollinger Bands visualize volatility expansion and contraction around a moving average.
Which MT4 indicator is best for trend strength?
ADX is specifically designed to help identify whether a meaningful trend is present, while +DI and -DI add directional context.
Can MT4 indicators predict the market?
No. Indicators analyze market data and can support systematic decisions, but they cannot predict future prices with certainty.
How many indicators should I use on MT4?
Many traders are better served by two to four complementary tools than by a chart filled with overlapping indicators.
Do MT4 indicators repaint?
Some custom indicators can repaint historical signals. Built-in indicators also update while the current candle is forming, so evaluate signals after bar close when appropriate.
Can MT4 indicators be automated?
Yes. Expert Advisors can use indicator values as inputs for automated trading rules.
Do I need a VPS for MT4 indicators?
No for manual analysis. A VPS becomes useful when an EA or signal-copying system based on indicators needs to run continuously.
What is the best MT4 indicator combination?
A useful combination is one trend tool, one momentum tool, and one volatility/risk tool—for example Moving Average, RSI, and ATR.